Following graph shows a comparison of the approximate sale of items manufactured by a company for the first two years of its operation.
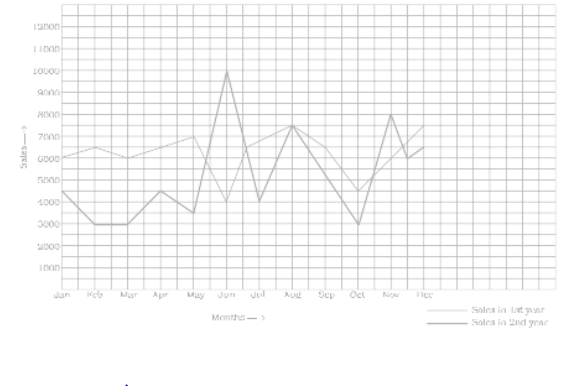
In which year was there more stability in the sale of
items?
(iii) In which month the sale remains the same in both the years?