Login
Remember
Register
Home
All Activity
Q&A
Questions
Hot!
Unanswered
Tags
Categories
Users
Ask a Question
Ask a Question
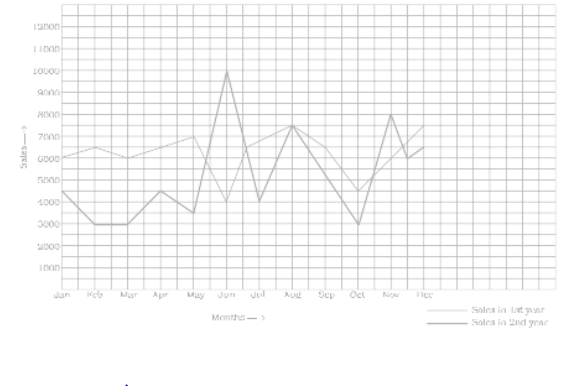
Following graph shows a comparison of the approximate sale of items manufactured by a company for the first two years of its operation. (i) In which months there was maximum difference inthe sale of items of two
0
votes
asked
Jan 17, 2022
in
8th-maths
by
nikhil
(
1.8k
points)
Following graph shows a comparison of the approximate sale of items manufactured by a company for the first two years of its operation.
(i) In which months there was maximum difference inthe sale of items of two years?
marks1
chapter12
#sub
Please
log in
or
register
to answer this question.
0
Answers
Categories
All categories
Maths
(8.6k)
12th-maths
(0)
11th-maths
(0)
10th maths
(0)
9th-maths
(0)
8th-maths
(8.6k)
Science
(14)
Physics
(3.4k)
Related questions
Following graph shows a comparison of the approximate sale of items manufactured by a company for the first two years of its operation. (i) In which months there was maximum difference inthe sale of items of two
Following graph shows a comparison of the approximate sale of items manufactured by a company for the first two years of its operation. (i) In which months there was maximum difference inthe sale of items of two
Following graph shows a comparison of the approximate sale of items manufactured by a company for the first two years of its operation. In which year was there more stability in the sale ofitems?(iii) In which month the sale remains the same in both the
Following graph shows a comparison of the approximate sale of items manufactured by a company for the first two years of its operation. In which year was there more stability in the sale ofitems?(iii) In which month the sale remains the same in both the
Following graph shows a comparison of the approximate sale of items manufactured by a company for the first two years of its operation. In which year was there more stability in the sale ofitems?(iii) In which month the sale remains the same in both the