Login
Remember
Register
Home
All Activity
Q&A
Questions
Hot!
Unanswered
Tags
Categories
Users
Ask a Question
Ask a Question
The following is a conversion graph of temperature in °Cand °F.Use the graph to answer the following questions.(a) Convert 140 °F to °C.(b) Convert 20 °C to
0
votes
asked
Jan 18, 2022
in
8th-maths
by
krutika
(
1.7k
points)
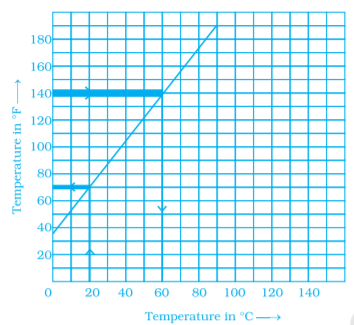
The following is a conversion graph of temperature in °C
and °F.
Use the graph to answer the following questions.
(a) Convert 140 °F to °C.
(b) Convert 20 °C to °F
marks1
chapter12
#sub
Please
log in
or
register
to answer this question.
0
Answers
Categories
All categories
Maths
(8.6k)
12th-maths
(0)
11th-maths
(0)
10th maths
(0)
9th-maths
(0)
8th-maths
(8.6k)
Science
(14)
Physics
(3.4k)
Related questions
The following is a conversion graph of temperature in °Cand °F.Use the graph to answer the following questions.(a) Convert 140 °F to °C.(b) Convert 20 °C to
The following is a conversion graph of temperature in °Cand °F.Use the graph to answer the following questions.(a) Convert 140 °F to °C.(b) Convert 20 °C to
The following graph shows the change in temperature of a block of ice when heated. Use the graph to answer the following questions: (a) For how many seconds did the ice block have no change in temperature?(b) For how long was there a change in
The following graph shows the change in temperature of a block of ice when heated. Use the graph to answer the following questions: (a) After how many seconds of heating did the temperature become constant at 0°C?(b) What was the temperature after 25 seconds?(c) What will be the temperature
The following graph shows the change in temperature of a block of ice when heated. Use the graph to answer the following questions: (a) For how many seconds did the ice block have no change in temperature?(b) For how long was there a change in