The following graph shows the change in temperature of a block of ice when heated. Use the graph to answer the following questions:
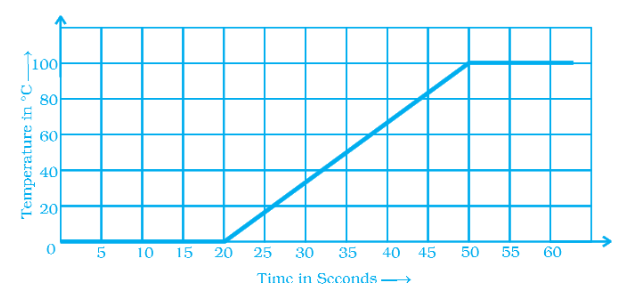
(a) For how many seconds did the ice block have no change in temperature?
(b) For how long was there a change in temperature?