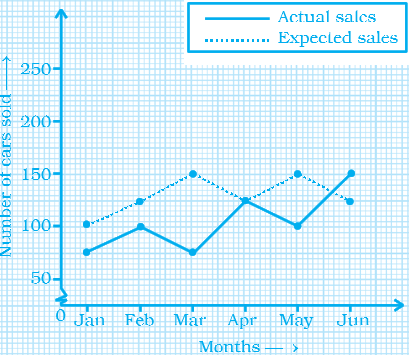
The gra ph given below gives the actual and expected sales of cars
of a company for 6 months. Study the graph and answer the questions
that follow.
(a) In which month was the actual sales same as the expected sales?
(b) For which month(s) was (were) the difference in actual and
expected sales the maximum?
(c) For which month(s) was (were) the difference in actual and
expected sales the least?
(d) What was the total sales of cars in the months–Jan, Feb. and
March?
(e) What is the average sales of cars in the last three months?
(f) Find the ratio of sales in the first three months to the last three
months.