The graph given below compares the sales of ice creams of two vendors
for a week.
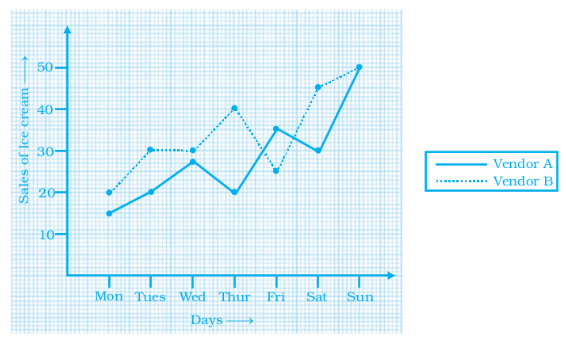
Observe the graph and answer the following questions.
(a)On which day did the sale of vendor A increase the most as compared to the previous day?
(b) On which day was the difference in sales the maximum?
(c) On which two days was the sales same for vendor B?