The two graphs below compare Car A and Car B. The left graph shows the relationship between age and value. The right graph shows the relationship between size and maximum speed. Use the graphs to determine whether each statement is true or false, and explain your answer.
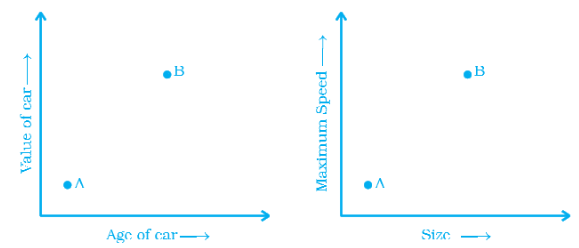
(a) The larger car is older.
(b) The faster car is older.
(c) The more valuable car is slower.