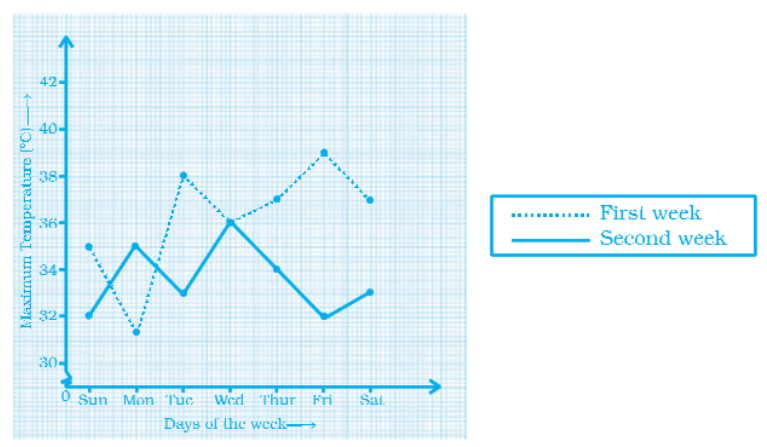
The graph shows the maximum temperatures recorded for two consecutive weeks of a town. Study the graph and answer the questions that follow.
Options:
(a) What information is given by the two axes?
(b) In which week was the temperature higher on most of the days?
(c) On which day was the temperature same in both the weeks?
(d) On which day was the difference in temperatures the maximum
for both the weeks?
(e) What were the temperatures for both the weeks on Thursday?
(f) On which day was the temperature 35°C for the first week?
(g) On which day was the temperature highest for the second week?