As part of his science project, Prithvi was supposed to record the temperature every hour one Saturday from 6 am to midnight. At noon, he was taking lunch and forgot to record the temperature. At 8:00 pm, his favourite show came on and so forgot again. He recorded the data so collected on a graph sheet as shown below.
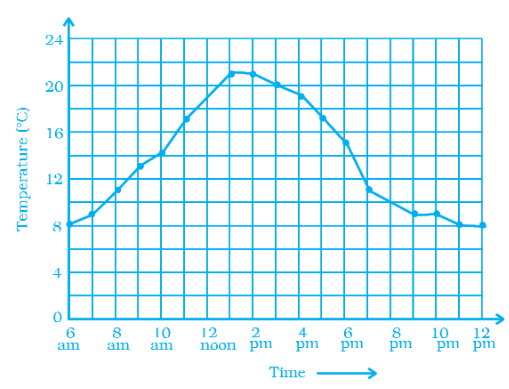
(a) Why does it make sense to connect the points in this situation?
(b)Describe the overall trend, or pattern, in the way the temperature changes over the time period shown on the graph.
(c) Estimate the temperature at noon and 8 pm.