Login
Remember
Register
Home
All Activity
Q&A
Questions
Hot!
Unanswered
Tags
Categories
Users
Ask a Question
Ask a Question
The points on the graph below represent the height and weight ofthe donkey, dog, crocodile, and ostrich shown in the drawing. (a) What are the two variables represented in the
0
votes
asked
Jan 17, 2022
in
8th-maths
by
yogita
(
1.8k
points)
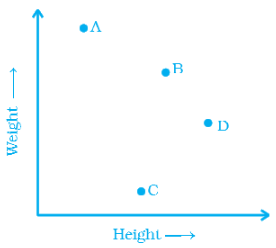
The points on the graph below represent the height and weight of
the donkey, dog, crocodile, and ostrich shown in the drawing.
(a) What are the two variables represented in the graph?
marks2
chapter12
#sub
Please
log in
or
register
to answer this question.
0
Answers
Categories
All categories
Maths
(8.6k)
12th-maths
(0)
11th-maths
(0)
10th maths
(0)
9th-maths
(0)
8th-maths
(8.6k)
Science
(14)
Physics
(3.4k)
Related questions
The points on the graph below represent the height and weight ofthe donkey, dog, crocodile, and ostrich shown in the drawing. (a) What are the two variables represented in the
The points on the graph below represent the height and weight ofthe donkey, dog, crocodile, and ostrich shown in the drawing. (a) What are the two variables represented in the
The points on the graph below represent the height and weight ofthe donkey, dog, crocodile, and ostrich shown in the drawing. (a) Which point represents each animals?
The points on the graph below represent the height and weight ofthe donkey, dog, crocodile, and ostrich shown in the drawing. (a) Which point represents each animals?
The points on the graph below represent the height and weight ofthe donkey, dog, crocodile, and ostrich shown in the drawing. (a) Which point represents each animals?