Login
Remember
Register
Home
All Activity
Q&A
Questions
Hot!
Unanswered
Tags
Categories
Users
Ask a Question
Ask a Question
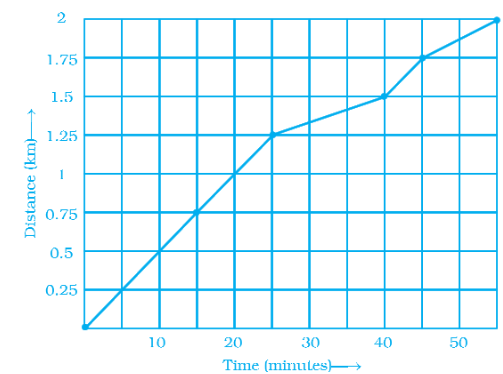
The following is the time-distance graph of Sneha’s
0
votes
asked
Jan 17, 2022
in
8th-maths
by
Arun
(
1.7k
points)
The following is the time-distance graph of Sneha’s walking.
marks2
chapter12
#sub
Please
log in
or
register
to answer this question.
0
Answers
Categories
All categories
Maths
(8.6k)
12th-maths
(0)
11th-maths
(0)
10th maths
(0)
9th-maths
(0)
8th-maths
(8.6k)
Science
(14)
Physics
(3.4k)
Related questions
The following is the time-distance graph of Sneha’s
The following is the time-distance graph of Sneha’s
The table shows the data collected for Dhruv’s walking on a road. Time(in minutes) 0 5 10 15 20 25 Distance (in km) 0 0.5 1 1.25 1.5 1.75 (a) Plot a line graph for the given data using a suitable scale.(b) In what time periods did Dhruv make the most
The table shows the data collected for Dhruv’s walking on a road. Time(in minutes) 0 5 10 15 20 25 Distance (in km) 0 0.5 1 1.25 1.5 1.75 (a) Plot a line graph for the given data using a suitable scale.(b) In what time periods did Dhruv make the most
The table shows the data collected for Dhruv’s walking on a road. Time(in minutes) 0 5 10 15 20 25 Distance (in km) 0 0.5 1 1.25 1.5 1.75 (a) Plot a line graph for the given data using a suitable scale.(b) In what time periods did Dhruv make the most