Figure shows plot of PV/T versus P for `1.00×10^(–3)` kg of oxygen gas at two different temperatures.
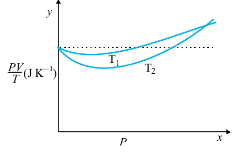
(a) What does the dotted plot signify?
(b) Which is true: T1 > T2 or T1< T2 ?
(c) What is the value of PV/T where the curves meet on the y-axis?
(d) If we obtained similar plots for 1.00×10⁻³ kg of hydrogen, would we get the same value of PV/T at the point where the curves meet on the y-axis? If not, what mass of hydrogen yields the same value of PV/T (for low pressure high temperature region of the plot) ? (Molecular mass of `H_2`= 2.02 u, of `O_2` = 32.0 u, R = 8.31 J 'mo1^(–1)` `K ^(–1)`.).