The graph given below shows the marks obtained out of 10 by Sonia
in two different tests. Study the graph and answer the questions
that follow.
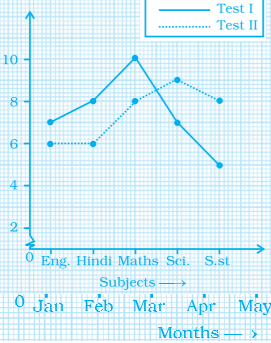
(a) What information is represented by the axes?
(b) In which subject did she score the highest in Test I?
(c) In which subject did she score the least in Test II?
(d) In which subject did she score the same marks in both the Tests?
(e) What are the marks scored by her in English in Test II?
(f) In which test was the performance better?
(g) In which subject and which test did she score full marks?