Login
Remember
Register
Home
All Activity
Q&A
Questions
Hot!
Unanswered
Tags
Categories
Users
Ask a Question
Ask a Question
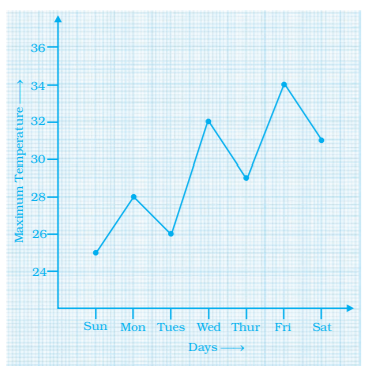
Study the graph and answer the questions that follow.(a) What information does the graph give?(b) On which day was the temperature the least?(c) On which day was the temperature 31°C?(d) Which was the hottest
0
votes
asked
Jan 18, 2022
in
8th-maths
by
nikhil
(
1.8k
points)
Study the graph and answer the questions that follow.
(a) What information does the graph give?
(b) On which day was the temperature the least?
(c) On which day was the temperature 31°C?
(d) Which was the hottest day?
marks3
chapter12
#mtf
Please
log in
or
register
to answer this question.
0
Answers
Categories
All categories
Maths
(8.6k)
12th-maths
(0)
11th-maths
(0)
10th maths
(0)
9th-maths
(0)
8th-maths
(8.6k)
Science
(14)
Physics
(3.4k)
Related questions
Study the graph and answer the questions that follow.(a) What information does the graph give?(b) On which day was the temperature the least?(c) On which day was the temperature 31°C?(d) Which was the hottest
Study the graph and answer the questions that follow.(a) What information does the graph give?(b) On which day was the temperature the least?(c) On which day was the temperature 31°C?(d) Which was the hottest
The graph given below shows the marks obtained out of 10 by Soniain two different tests. Study the graph and answer the questionsthat follow.(a) What information is represented by the axes?(b) In which subject did she score the highest in Test I?(c) In which subject did she score the least in Test II?(d) In which subject did she score the same marks in both the Tests?(e) What are the marks scored by her in English in Test II?(f) In which test was the performance better?(g) In which subject and which test did she score full
The graph given below shows the marks obtained out of 10 by Soniain two different tests. Study the graph and answer the questionsthat follow.(a) What information is represented by the axes?(b) In which subject did she score the highest in Test I?(c) In which subject did she score the least in Test II?(d) In which subject did she score the same marks in both the Tests?(e) What are the marks scored by her in English in Test II?(f) In which test was the performance better?(g) In which subject and which test did she score full
The graph given below shows the marks obtained out of 10 by Soniain two different tests. Study the graph and answer the questionsthat follow.(a) What information is represented by the axes?(b) In which subject did she score the highest in Test I?(c) In which subject did she score the least in Test II?(d) In which subject did she score the same marks in both the Tests?(e) What are the marks scored by her in English in Test II?(f) In which test was the performance better?(g) In which subject and which test did she score full