The following graph shows the number of people present at a certain shop at different times. Observe the graph and answer the following questions.
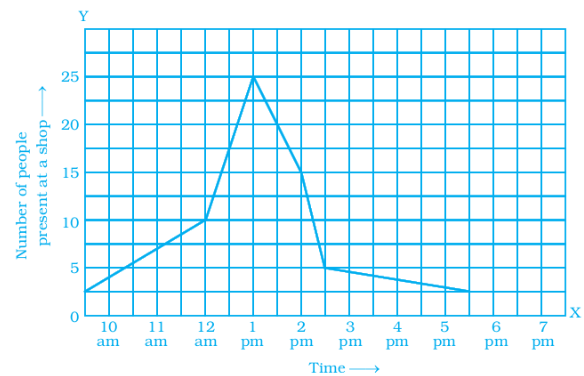
(a) What is the busiest time of day at the shop?
(b) How many people enter the shop when it opens?
(c) About how many people are there in the shop at 1:30 pm?