Match the Column I (graph) with Column II (relation) and select the correct answer from the codes given below.
| Column I | Column II |
A. 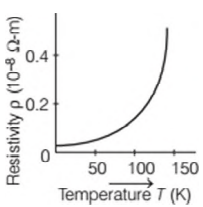 | p. Temperature dependence of resistivity for a typical semiconductor. |
B. 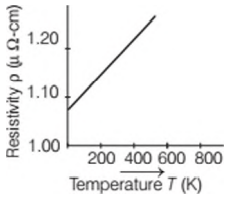 | q. Resistivity p of copper as a function of temperature T. |
C. 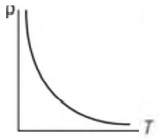 | r. Resistivity `rho` of nichrome as a function of absolute temperature T . |
Options:
(a) A-r B-q C-p
(b) A-q B-p C-r
(c) A-q B-r C-p
(d) A-r B-p C-q